

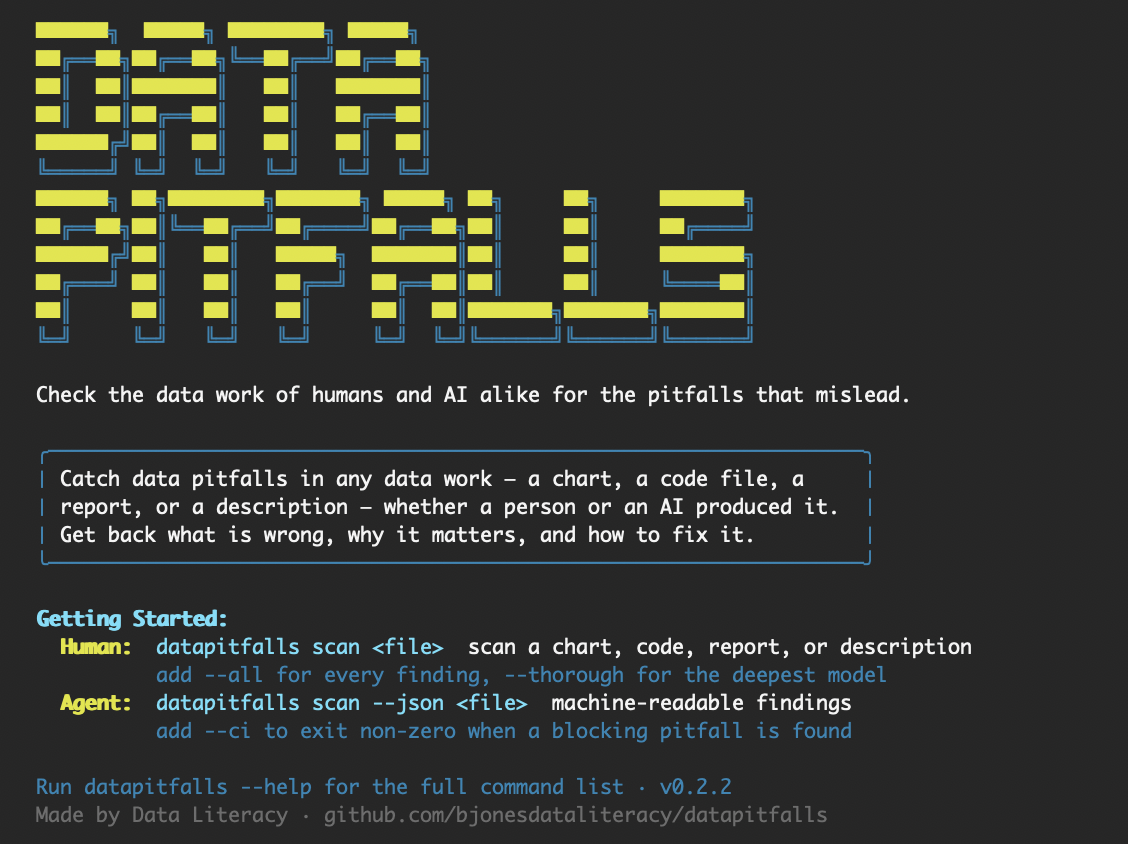

avoidingdatapitfalls.com/scan: run a scan right now, no install required. The home page covers the book, the Data Pitfalls MCP for Claude, and the pitfall library.
datapitfalls is an open-source tool that detects the common blunders in your data work that trip up even seasoned practitioners — and its pitfall taxonomy spans the entire data reasoning chain, from the question you start with to the chart you finish with, not just the final pixels.
Most "chart linters" stop at the pixels: they'll tell you your axis is truncated or your colors fail a contrast check. That's useful, but it's a sliver of where data work actually goes wrong. The most consequential mistakes happen upstream — in how a question is framed, how data is collected, how it's transformed, how it's analyzed, and how the results are finally interpreted and communicated. A perfectly formatted chart built on a cherry-picked timeframe is still misleading. A flawless SQL query that silently drops nulls still lies.
Its pitfall catalog spans the whole chain:
question formulation → data collection → transformation → analysis → visualization → interpretation → communication
It's powered by the Claude API and grounded in the pitfall taxonomy from the book Avoiding Data Pitfalls (Wiley) by Ben Jones. Give it a chart, a code snippet, a plain-English description of your analysis, or a whole report — and it returns a structured audit that names the pitfalls, explains why they matter, and tells you how to fix them.
Today you scan one piece at a time — a chart (or several together), a code snippet, a description, or a single document (a PDF report is read end-to-end, prose and charts alike). Detecting pitfalls across a connected, multi-stage workflow as one linked chain is on the roadmap.
This is not a style checker. It's a thinking partner for anyone who wants to work with data more honestly.
datapitfalls organizes every pitfall into one of eight domains — the pitfall categories from Avoiding Data Pitfalls. Together they span the full arc of a data project.
  ┌─────────────────────────────────────────────────────────────────────┐
  │                                                                       │
  │   1.  EPISTEMIC ERRORS        How we think about and know things      │
  │       └─ confirmation bias · anchoring · the streetlight effect ·     │
  │          precision/accuracy confusion · correlation ≠ causation       │
  │                                                                       │
  │   2.  TECHNICAL TRESPASSES    How data breaks in the pipeline         │
  │       └─ silent null drops · join explosions · type coercion ·        │
  │          encoding issues · pipeline failures                          │
  │                                                                       │
  │   3.  MATHEMATICAL MISCUES    How the numbers go sideways             │
  │       └─ % vs. percentage points · index-number misuse ·              │
  │          compounding errors · denominator blindness                   │
  │                                                                       │
  │   4.  STATISTICAL SLIP-UPS    How inference misleads                  │
  │       └─ Simpson's paradox · base-rate neglect · regression to the    │
  │          mean · multiple comparisons · sampling & survivorship bias   │
  │                                                                       │
  │   5.  ANALYTICAL ABERRATIONS  How analysis distorts                   │
  │       └─ cherry-picked timeframes · inappropriate aggregation ·       │
  │          apples-to-oranges comparisons · missing context             │
  │                                                                       │
  │   6.  GRAPHICAL GAFFES        How charts deceive                      │
  │       └─ truncated axes · misleading encodings · accessibility        │
  │          failures · chartjunk · dual-axis tricks · 3D distortion      │
  │                                                                       │
  │   7.  DESIGN DANGERS          How presentation fails the audience     │
  │       └─ poor layout · missing titles/labels · cluttered dashboards · │
  │          ignoring audience needs · form over function                 │
  │                                                                       │
  │   8.  BIASED BASELINE         Who has a voice in the data             │
  │       └─ unheard voices · undervalued contributions ·                 │
  │          misattributed credit · non-representative sources            │
  │                                                                       │
  └─────────────────────────────────────────────────────────────────────┘
datapitfalls is designed around four input modes, so you can scan your work at whatever stage you're in.
⚠️ Status: The datapitfalls detection engine is live, and you can use it two ways. The command line scans chart images, code snippets, and plain-English descriptions (modes 1–3 below), with a--ciexit code for pipelines. A web app (inweb/) does all of that in the browser and adds document upload — PDF read natively (so Claude reviews the prose and the charts and tables), Word.docx, PowerPoint.pptxdecks, Jupyter notebooks, and code files — plus multi-chart scans that compare several charts at once. The web app is per-IP rate-limited, and your input is sent to the Claude API to run the scan but isn't stored by the app. Install the CLI and engine withnpm install datapitfalls, or run the web app locally withcd web && npm run dev. It's live at avoidingdatapitfalls.com/scan.
npx datapitfalls scan ./quarterly-revenue.pngUpload a chart and let Claude Vision flag truncated axes, misleading encodings, missing context, and accessibility issues.
npx datapitfalls scan ./transform.sql-- datapitfalls will flag the silent inner-join filtering below
SELECT u.id, o.total
FROM users u
JOIN orders o ON u.id = o.user_id; -- users with no orders silently disappearnpx datapitfalls scan --text "We compared this year's signups to last year's, \
but only counted users who are still active today."datapitfalls recognizes the survivorship bias hiding in that sentence.
In the web app, drop in a PDF report and Claude scans the whole thing in context — the written claims and the charts and tables on the page (Word .docx, PowerPoint .pptx decks, Jupyter notebooks, and code files work too). Or add several chart images together for a multi-chart scan that catches pitfalls across them: inconsistent scales, inconsistent encodings, and contradictory messages.
# Install as a project dependency
npm install datapitfalls

# …or run the CLI without installing
npx datapitfalls scan ./my-chart.png
You'll need a Claude API key from Anthropic. Set it in your environment:
export ANTHROPIC_API_KEY="sk-ant-..."datapitfalls requires Node.js 18 or later.
datapitfalls also runs as an MCP server that gives Claude the Avoiding Data Pitfalls taxonomy wherever you use it: Claude Code, Claude Desktop, and claude.ai. Claude does the checking itself, using the rules, so the server needs no API key and makes no Anthropic API calls. It is read-only and never touches the network.
Once it's connected, ask something like "Build this dashboard, then check every chart's SQL and design against datapitfalls and fix what you find."
It offers four tools: get_checklist (the rules to check for SQL, code, a
chart, prose, a dashboard or a document), get_pitfall (one rule in full),
list_pitfalls, and search_pitfalls; a review_for_pitfalls prompt; and each
rule as a datapitfalls://rules/{id} resource.
Claude Code
claude mcp add datapitfalls -- npx -y datapitfalls mcpClaude Desktop: add this to claude_desktop_config.json (Settings →
Developer → Edit Config), then restart Claude Desktop:
{
  "mcpServers": {
    "datapitfalls": {
      "command": "npx",
      "args": ["-y", "datapitfalls", "mcp"]
    }
  }
}
claude.ai (custom connector): in Settings → Connectors, choose Add custom
connector, name it Data Pitfalls, and use the URL
https://www.avoidingdatapitfalls.com/api/mcp. No authentication is needed.
Setup and usage are also at
avoidingdatapitfalls.com/mcp, and the
privacy policy is at
avoidingdatapitfalls.com/privacy.
Beyond the CLI, datapitfalls is a library you can build on. The core is
detectPitfalls(), which scans an artifact (or a whole analysis chain) and
returns a structured report:
import { detectPitfalls, formatReport, hasBlockingFindings } from 'datapitfalls';

const report = await detectPitfalls(
  { kind: 'code', content: 'SELECT AVG(rate) FROM metrics;', language: 'SQL' },
  { apiKey: process.env.ANTHROPIC_API_KEY }
);

console.log(formatReport(report));
if (hasBlockingFindings(report)) process.exit(1);
The package is ESM-only and ships its own TypeScript types. See the API reference for the full supported surface — inputs, report shape, file routing, taxonomy queries — and the API-stability policy.
It also ships a dependency-free bridge to Semiotic:
toSemioticAnnotations(report) turns findings into the Semiotic v3 annotation
specs its annotations prop consumes, so a chart you audited can render its own
warnings. It's the reciprocal of
nteract/semiotic#1030 (Semiotic →
datapitfalls). Because datapitfalls sees findings, not pixel coordinates, the
annotations are emitted unanchored — the host app positions them. See
Bridging to Semiotic.
   ┌──────────────┐     ┌──────────────────┐     ┌──────────────┐     ┌──────────────────┐
   │  Your input  │ ──▶ │  Pitfall         │ ──▶ │  Claude API  │ ──▶ │  Structured      │
   │              │     │  taxonomy lookup │     │  analysis    │     │  pitfall report  │
   │  chart       │     │                  │     │              │     │                  │
   │  code        │     │  retrieve the    │     │  reason over │     │  pitfalls found, │
   │  description │     │  relevant rules  │     │  input +     │     │  severity, why   │
   │  document    │     │  from 8 domains  │     │  taxonomy    │     │  it matters, fix │
   └──────────────┘     └──────────────────┘     └──────────────┘     └──────────────────┘
- You provide input — a chart, a code snippet, a description, or a document.
- Taxonomy lookup — datapitfalls pulls the relevant pitfall rules from its catalog of eight pitfall domains.
- Claude API analysis — Claude reasons over your input and the pitfall taxonomy, grounded in the knowledge from Avoiding Data Pitfalls.
- Structured pitfall report — you get back a clear, prioritized list of pitfalls: what was found, how severe it is, why it matters, and how to fix it.
For the full technical picture, see docs/ARCHITECTURE.md.
datapitfalls is the software companion to Avoiding Data Pitfalls: How to Steer Clear of Common Blunders When Working with Data and Presenting Analysis and Visualizations by Ben Jones (Wiley, 2020).
The book distills two decades of teaching and practice into a map of where data work goes wrong — and that map is the foundation of this tool's pitfall taxonomy. Every rule datapitfalls applies traces back to a pitfall described in the book.
📘 Learn more at avoidingdatapitfalls.com
This project gets better with every pair of eyes on it. Whether you've found a bug, want to propose a brand-new pitfall rule, or want to improve the docs — you're welcome here.
Read the Contributing Guide to get started, and please review our Code of Conduct.
datapitfalls is being built in the open, phase by phase. See the full Roadmap to learn what's shipped, what's in progress, and what's coming next.
datapitfalls is released under the MIT License. © 2026 Ben Jones / Data Literacy, Inc.
Created by Ben Jones — author of Avoiding Data Pitfalls, founder of Data Literacy, Inc., and data visualization instructor at the University of Washington.
Built with Claude by Anthropic.
If datapitfalls helps you work with data more honestly, please ⭐ the repo.
0 comments
log in to comment.